From 1 MB to 279 KB: what was slowing down our home page
· 4 min read
Our home page scored as low as 54 on Lighthouse's mobile test. The causes were not the ones we expected, and most of the fixes were small.

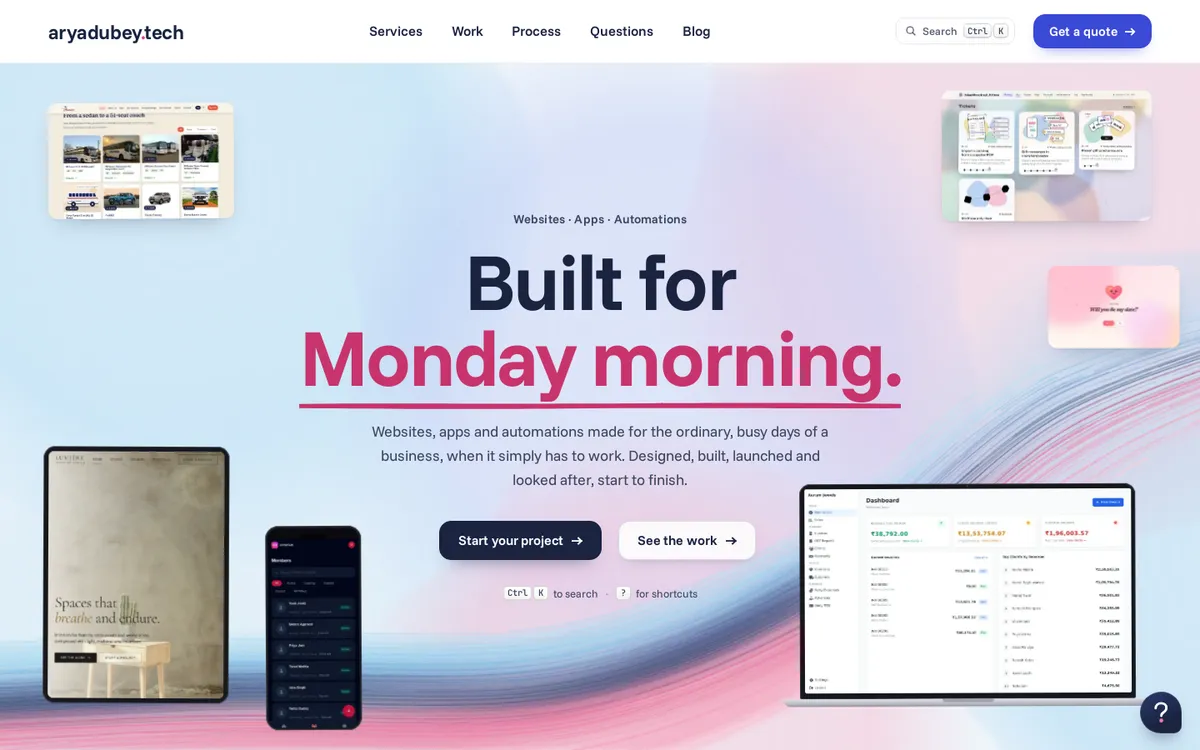
Our home page is one long story of animated scenes, full of real product screenshots. On Lighthouse's simulated mobile test it scored between 54 and 78. We read the traces instead of guessing, and most of what we found could be fixed in a few lines.
| Lighthouse mobile, simulated | Before (3 runs) | After (5 runs, median) |
|---|---|---|
| Score | 54 to 78 | 90 |
| Largest Contentful Paint | 3.6 to 7.0 s | 2.9 s |
| Total Blocking Time | 410 to 960 ms | 230 ms |
| Page weight | 1,037 KB | 279 KB |
The before and after runs were made in the same way, on a small, busy server. The "after" score, LCP and blocking time come from the live site. Everything else comes from the same page on its preview address. Read them as a comparison, not as what your phone will show.
#loading="lazy" was doing nothing
Our scenes are stacked on one sticky stage. To the browser, every stacked slide counts as in view, so lazy loading never held anything back and 25 images started loading at once.

We now keep off-stage images parked in data-src and fill them in just ahead of the visitor:
ticker(() => {
  const u = window.__story?.u() ?? 0
  for (const it of items) if (!it.done && it.s < u + AHEAD && it.s > u - BEHIND) { it.done = true; fill(it.el) }
})
Before any input, only the hero's own pictures load. This mattered more than it looks, because Lighthouse's simulation charges for every request started before first paint. The same page measured an LCP of 0.4 s when we observed it directly on the server's fast connection, while the simulated slow-phone figure was 3.6 to 7 s. We put much of that gap down to those early requests.
#Two CSS variables were restyling 815 elements
The trace showed long UpdateLayoutTree entries, with up to 815 elements restyled on a single write. The cause was two custom properties set on large containers. Custom properties inherit by default, so changing one makes the browser recheck the whole subtree.
Nothing below those containers read them from a parent, so we told the browser not to inherit them:
@property --total { syntax: '<number>'; inherits: false; initial-value: 20; }
@property --fit   { syntax: '<number>'; inherits: false; initial-value: 1; }
No JavaScript changed. In our tests this alone took Total Blocking Time from over 400 ms to about 130 ms.
We had hit the same problem earlier in a louder form. A pointer effect wrote --mx and --my to :root on every mouse move, and on a page of 1,051 elements that cost about 20 ms of style work per frame. Headless, the page ran at 13 fps. Set variables on the smallest wrapper you can, or write transform straight onto the moving elements.
#The logo was the LCP element
The hero's intro animation started its headline at opacity 0. Browsers don't count invisible text, so the largest thing painted first was the logo, and our real LCP moment arrived late. Now the headline paints straight away and the animation works around it.
#Smaller wins
| What | Change |
|---|---|
| Fonts | 156 KB down to 15 KB by subsetting and self-hosting. The main font is preloaded. |
| Scroll engine | Used to run before first paint. It now starts at page load, first input or 1.8 s. |
| ScrollTrigger | Removed from the bundle. |
Subsetting has a catch: a font's subset can come without arrows at all. Ours did, so a 464-byte font of our own holds just the arrows and the tick.
#Frame rate is a separate problem
Load speed was only half of it. We also test frame rate by turning decorative layers off one at a time, and two results surprised us:
- A full-screen tiled SVG grain layer above a changing canvas dropped idle frame rate from 59 to 45, and from 57 to 21 during interaction.
filter: drop-shadowon cards. We had chosen it because filter transitions can run on the compositor. Replacing the card shadows and some backdrop blurs with plainbox-shadowtook idle from about 40 fps to 60.
Be careful with that second one. Our test machine has no GPU, so filters and blurs cost more here than on most real devices. We took it as a direction, not a universal rule.
#What we'd tell ourselves earlier
Read the trace before changing anything. The elementCount and stack on a style recalculation point straight at the cause, and neither of our two biggest finds looked like a performance problem in the code.
You can check the result yourself: run Lighthouse on our home page. Expect different numbers from ours, since they depend on the machine.